Overview
The project was a practical exercise of implementing Particle Filters, as part of the Self-Driving Car Engineer Nanodegree in Udacity.
Project Introduction
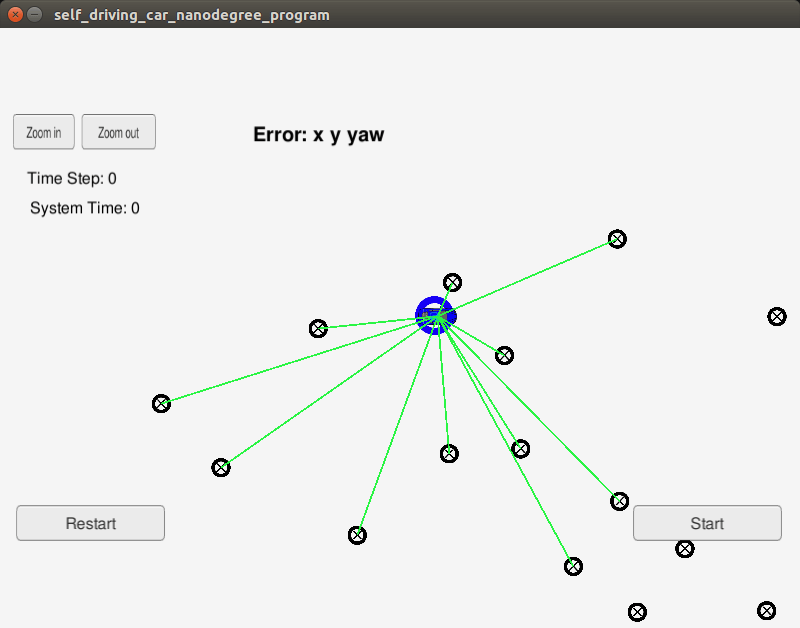
Your robot has been kidnapped and transported to a new location! Luckily it has a map of this location, a (noisy) GPS estimate of its initial location, and lots of (noisy) sensor and control data.
In this project you will implement a 2 dimensional particle filter in C++. Your particle filter will be given a map and some initial localization information (analogous to what a GPS would provide). At each time step your filter will also get observation and control data.
My Goals
While it would be fairly easy to implement Particle Filters just to make it run and pass, I aim to invest a bit more, to achieve the following:
- Add another portfolio entry that showcases my C++ skills.
- Practice using the standard C++ algorithms library. In the past I have worked with functional programming in Python and Haskell, but do not have provable experience of it in C++. More importantly, I currently have doubts on how useful / readable it is and need to get my hands dirty to decide.
- (Optionally) recode my implementation in Eigen. I absolutely love vectorization in Python, but do not have much experience of it in C++.
Success Criteria
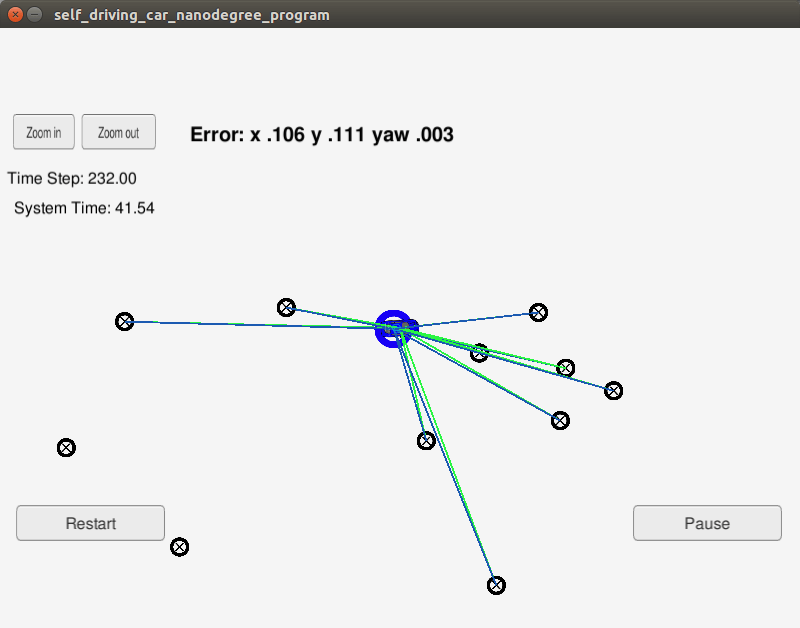
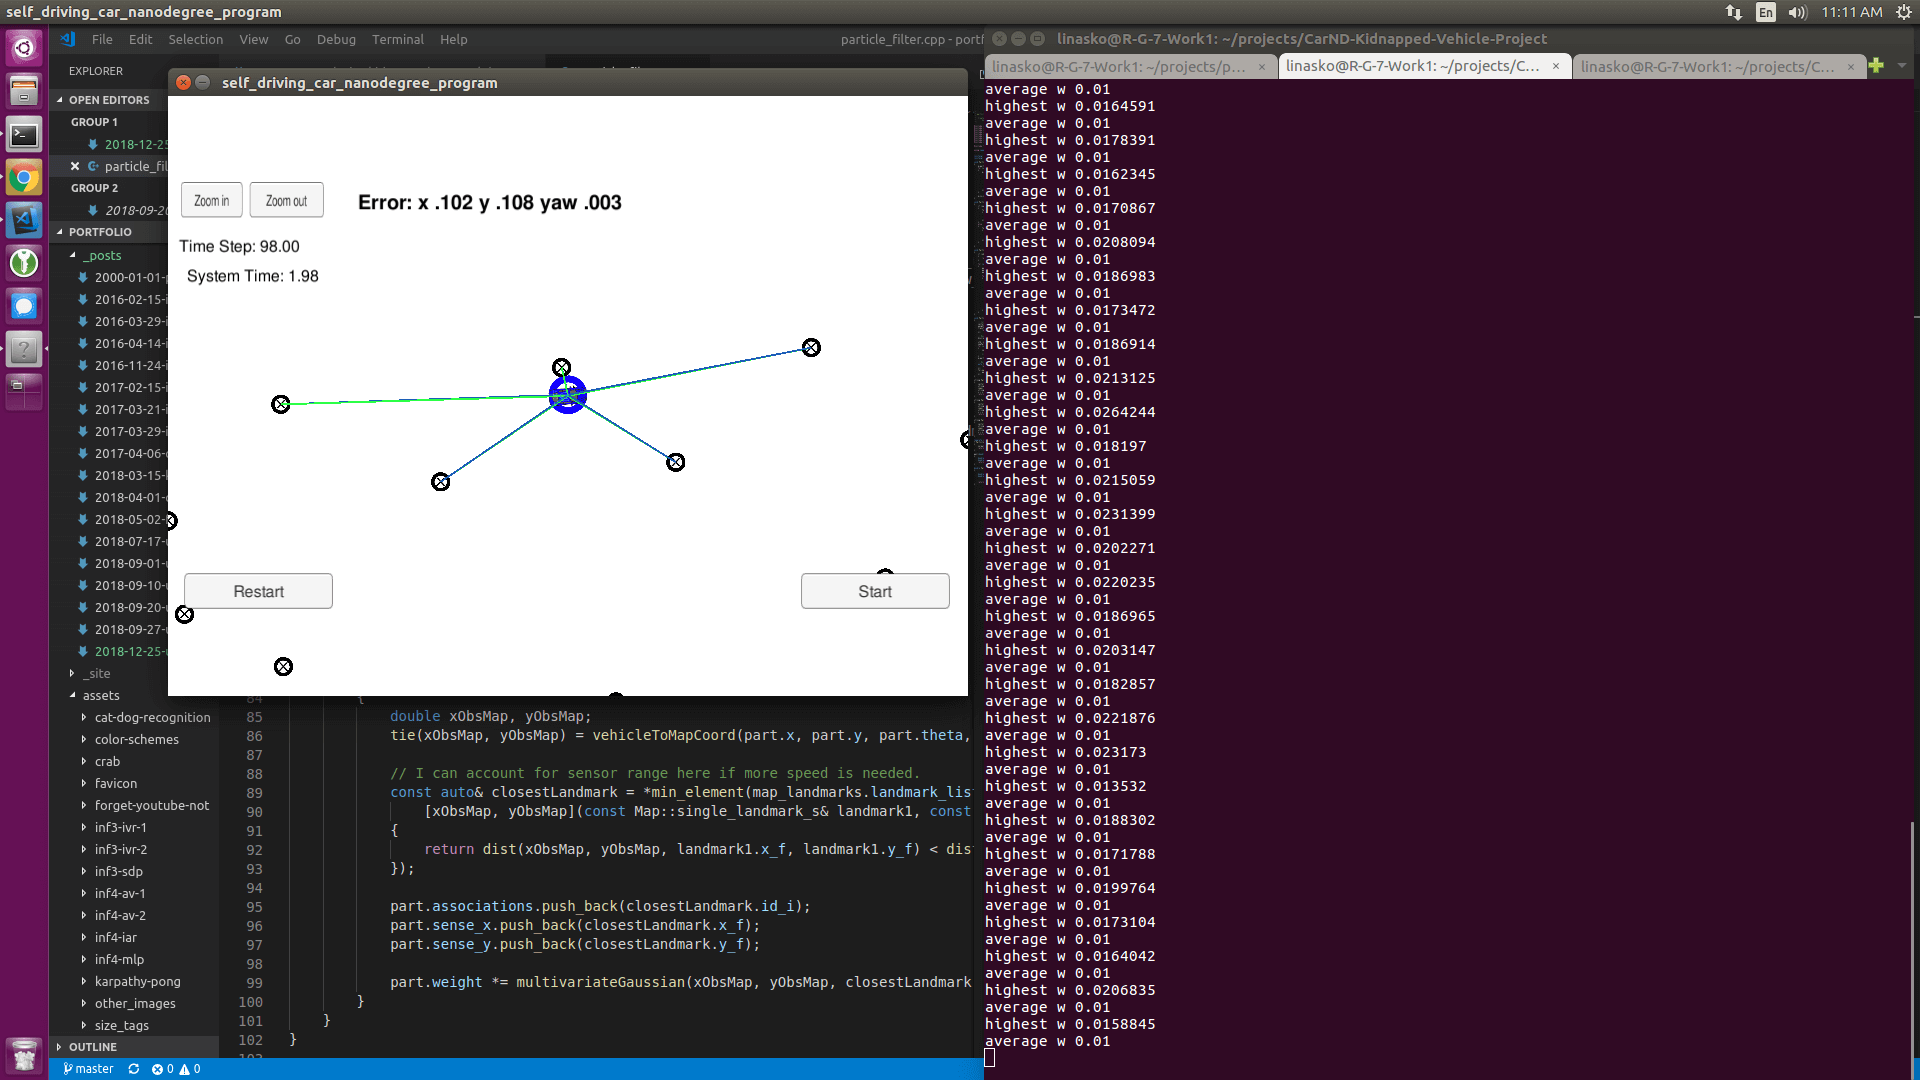
The particle filter has to pass accuracy and time requirements. Both are specified in the simulator, which notifies if the filter is accepted.
The things the grading code is looking for are:
-
Accuracy: the particle filter should localize vehicle position and yaw to within the values specified
in the parametersin the simulator source code.max_translation_errorandmax_yaw_errorinsrc/main.cpp -
Performance: your particle filter should complete execution within the time of 100 seconds.
Effectively, the task is to build out the methods in particle_filter.cpp until the simulator output says:
Success! Your particle filter passed!
Running the Code
The instructions can be found in the README file of the project repository.
Results
The implementation passed the grading criteria fairly easily. I believe I have managed not only to write the code elegantly, but also trim down a fair bit of the code given to us.
Ultimately, I have also recoded a large part of the project in Eigen, which can be found on a separate branch. In the end, I did not go as far as vectorizing absolutely everything (that would require tensors, that Eigen supports experimentally), but I have gained a fair bit of intuitive understanding of the common data structures and principles used in developing with Eigen.
Shortcomings
In light of my goals, here are the obvious shortcomings that I see in my implementation:
- Lack of error handling. To keep the code concise I skipped on a fair bit of error handling. Normally, I’d have more asserts or make sure everything’s airtight with unit tests.
- Nearest-Neighbour search not optimized The code can be made faster by using sensor range provided to us specifically to search for landmark-observation associations in a bounded window. However, this sacrifices code clarity, as well as not being the best solution here. An even better approach would be to also use K-D trees to store the landmarks, speeding the search from roughly O(n2) to O(log(n)), especially when the map never changes.
Code Repository: GitHub
Main Project File: GitHub
Main Project File (Eigen re-implementation): GitHub


