


This project served as an introduction to lane line detection, as part of the Self-Driving Car Engineer Nanodegree in Udacity. Given videos of a highway, filmed using a camera attached on the inside of the vehicle, I had to detect and draw the lane lines on the road.
Data
Three videos were given as input:
- solidWhiteRight.mp4 (8s)- a simple situation where the car just drove straight and had a dashed lane line on the right and a solid white line on the right.
- solidYellowLeft.mp4 (27s) - a very similar video where the car just drove straight, but had a solid yellow line on the left and a dashed line on the right.
- challenge.mp4 (10s, optional) - a slightly more complicated video where the car was perpetually turning to the right, the hood of the car was visible, and one section of the road suddenly has a patch of different textured road, as well as tree shadows cast on the road.
As this was an introductory task, the dataset was almost perfect - it depicted a clear sunny day, yet light reflections on the window were mninimal; the pavement contracted nicely with the lane lines; other vehicles were not obstructing the view; there were no sharp turns that vehicle had to make.
Methods
A full writeup of the methodology used can be found in writeup.md.
Generally, my pipeline was composed of the following parts:
- Read in one frame of the video
- Convert image to grayscale and threshold by image intensity
- Apply predefined lane mask, filtering out anything outside possible lane area
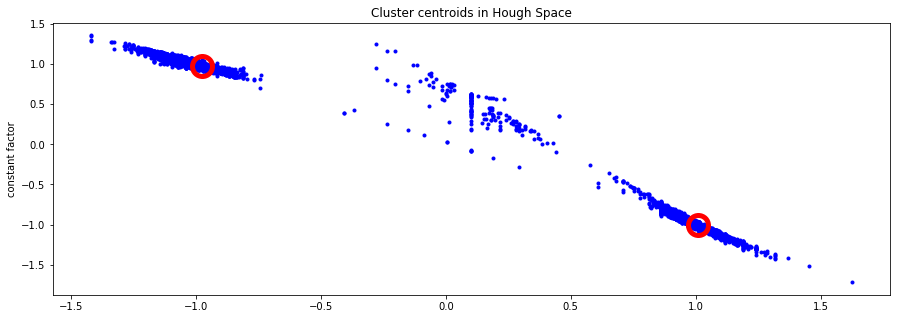
- Find possible lane lines based on location and density of line intersections in Hough Transform
- Find slopes and y-intercepts of all lines
- Remove outliers based on x-intercept location
- Add results to history (approximately 400ms long)
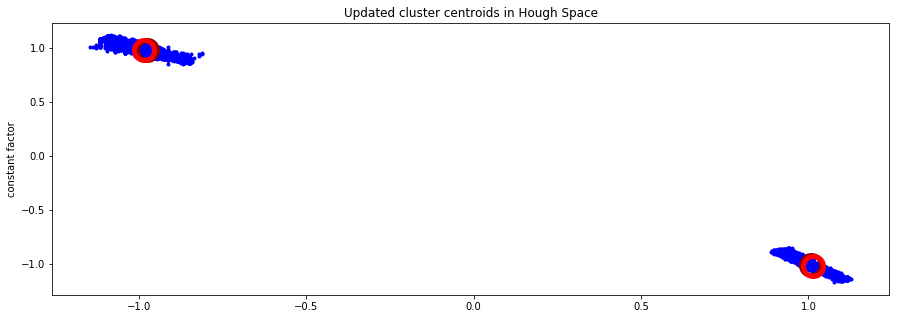
- Whiten data and remove outliers by using K-means clustering with 2 clusters, also taking into account the historical data.
- Cluster the history again without outliers to obtain the line estimate
- Extend line equations into lines in the image
- Overlay the results
Results
Ultimately, I believe the pipeline fairly accurately classifies the challenge video, while also displaying excellent performance on all other provided videos.
Since discussion is usually my favourite part of the writeup, here’s what I had:
Shortcomings
My method of extracting the lane lines is far from perfect. Off the top of my head, I can identify the following:
- It only considers one lane. The detector will not work when changing lanes or when further lanes need to be detected.
- I assume that the vehicle is between two lanes. When that is not the case, lane data from video could be ignored (as an outlier), the other lane can go out of detection mask area or another road feature could be detected as the lane (due to clustering expecting exactly 2 clusters).
- I assume that both lanes that I can see are fairly straight. If the car makes a sharp turn, the Hough Lines would give out significantly more noise.
- The view mask assumes a certain camera placement and angle. The constrains might not hold if the camera location or orientation on the vehicle is changed.
- The Algorithm can take up to 400 ms to respond to a change in irregular lane line data, due to my chosen history length.
- The found lines are straight and do not bend to fit the curvature of the road. The lines are also long, sometimes resulting in weird crossovers, as in the challenge video. I have deliberately left them like that for now, as the real solution would account for the curvature of the road and not just shorten the lines.
Possible improvements
- There has to be a way to figure out if the road is turning. One could attempt to find curved lines, use the known angle of the camera to estimate the center of horizon, scan each individual patch of the line, etc.
- Function of determining the best line equation for each side now uses mean. It might be better to incorporate median instead. I have seen improved results from using median in other projects, instead of the mean.
- I have not used the Canny Edge Detector, nor blurred the image. I have tested both, but did not see the improvement over just using thresholding. This is especially true when the lines are striped and have large gaps between each patch. Still, there must be a way to use the edge information to improve the algorithm - maybe there’s a way to join the two?
- I wonder if I could use image features to estimate motion or lines, e.g. SIFT, FAST.
link in a new tab Code Repository: GitHub
Main Notebook: Jupyter